Special Analysis: How Healthy Is Your Congressional District?
This analysis provides a snapshot of 11 preventive health measures reported by congressional district based on 2017 Behavioral Risk Factors Surveillance Survey data. These data highlight areas in which policymakers and health advocates can focus their efforts to improve the health status of entire communities.
How Healthy is Your Congressional District?
The United States spends $3.6 trillion annually on healthcare but Americans aren’t getting any healthier. Furthermore, health disparities — the preventable differences in the degree to which the burden of disease impacts population groups — are a reality in all communities. This special analysis, How Healthy is your Congressional District? created by TFAH with data provided by the Centers for Disease Control and Prevention, is a one-year snapshot of 11 health measures for every congressional district in all 50 states and the District of Columbia. These data were reported within the CDC’s Behavioral Risk Factors Surveillance System (BRFSS) for 2017.
Data should drive policymaking. Toward that goal, TFAH is providing this data reporting tool to policymakers, community leaders, health promotion advocates and other interested parties. The webpage provides data for policymakers and others who want to know more about the health of their Congressional districts. We believe making these comparative data easily available will help identify critical action steps and policies that if made will improve the health status of many Americans. These data also help identify those districts that are in the greatest need of health promoting policy interventions.
Why Analyze By Congressional District?
To the best of our knowledge, this webpage is the only source of information on these select 11 indicators reported by congressional district. Other existing data sources are most often available only at the state or county levels. This lack of data reported at the congressional district level can make it challenging for elected officials, their staff and local residents and organizations, to gain an accurate picture of the health concerns specific to a district.
Such information is important in determining the impact of and/or need for resources and significant health matters. The availability of data reported via this webpage also allows program targeting by congressional districts. In addition, the constituents of a district may find the information useful in prioritizing their community-level efforts, when seeking resources from private and public organizations, or when tracking trends over time and conferring with local leaders about issues of concern.
Use this webpage as a tool to target heath promoting policies
The information provided via this webpage should not be interpreted as a report card. There are health-related concerns in every district. The elevated health risks in certain districts are likely a reflection of the social, economic and environmental conditions related to their demographic composition.
Rather than being a report card, these data are provided to assist all of the residents of a district – including its elected officials – to understand what needs to be done to promote optimal health and well being at the local level.
Data reported as part of this website are:
- Percentage of adults who lack health insurance
- Percentage of adults who smoke
- Cholesterol screening within the previous 5 years among adults
- Visits to doctor for routine checkup within the past year among adults
- Percentage of adults who have been diagnosed with diabetes
- Percentage of adults who report their general health as fair or poor
- Percentage of adults who report their mental health as not good for more than 14 days
- Percentage of adults who report they could not see a doctor due to cost
- Percentage of adults who have obesity
- Percentage of adults who report they have no leisure-time physical activity
- Percentage of adults who received a flu shot or vaccine during the past 12 months
Ten of the eleven indicators are measures of adults aged 18 years and older; the health insurance measure (#1) is of adults 18-64.
All measures are based on 2017 Behavioral Risk Factors Surveillance Survey (BRFSS) data.
This page was refreshed on March 12, 2020.
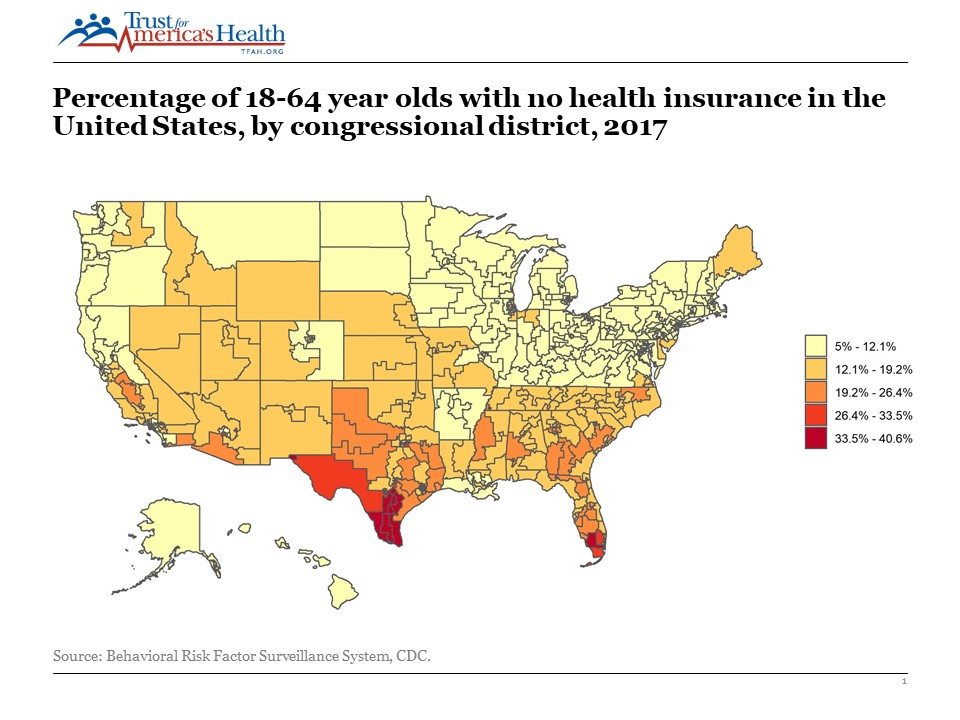
National map - percentage of adults who lack health insurance
| National Maps for all 11 indicators | State Maps & Data Reports |